


Introduction: Why I Decided to Tackle UML Class Diagrams
As someone transitioning into software architecture after years of backend development, I kept hitting a wall: my team needed clear, standardized documentation, and my hand-drawn sketches just weren’t cutting it. A colleague mentioned UML Class Diagrams, and honestly, I was intimidated. But after spending three weeks working through Visual Paradigm’s free resources and community tools, I can confidently say this journey transformed how I design systems. This isn’t a promotional piece—it’s my genuine, third-party perspective on what worked, what surprised me, and how you might approach learning UML without feeling overwhelmed. If you’re a developer, student, or tech lead looking to level up your modeling skills, here’s exactly what I experienced.

What Is a UML Class Diagram? (From a Beginner’s Perspective)
When I first opened Visual Paradigm Community Edition (yes, the free version), I expected complex menus and jargon. Instead, I found a clean interface that walked me through the basics. Here’s what clicked for me:
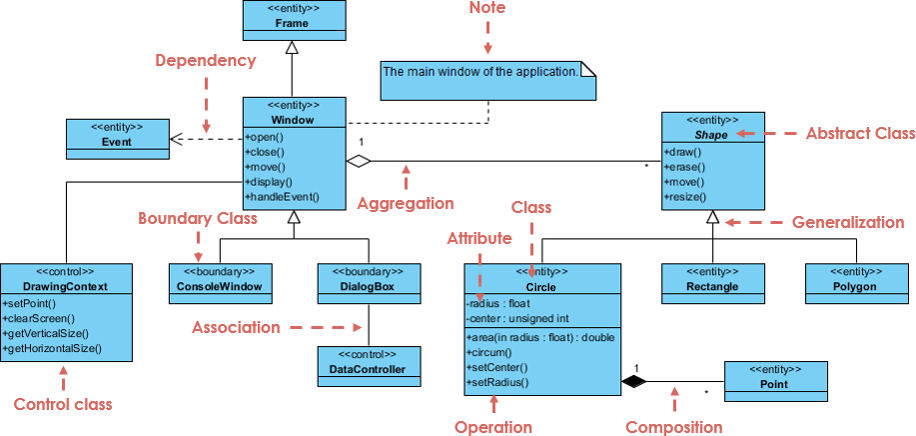
A UML Class diagram is a graphical notation used to construct and visualize object-oriented systems. It describes a system’s structure by showing:
classes,
their attributes,
operations (or methods),
and the relationships among objects.
Understanding Classes: The “Aha!” Moment
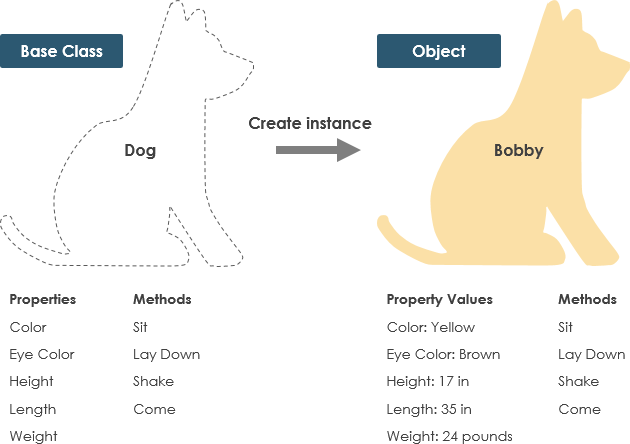
I used to confuse classes with objects. The tutorial’s dog example finally made it stick:
-
Class = Blueprint (e.g., “Dog” with properties like color, breed)
-
Object = Actual instance (e.g., “Buddy,” a specific brown Labrador)
This distinction is foundational. Without it, my early diagrams were messy. Visual Paradigm’s visual examples helped me internalize this faster than any textbook.
Decoding UML Class Notation: What Actually Matters
The Three-Part Class Box
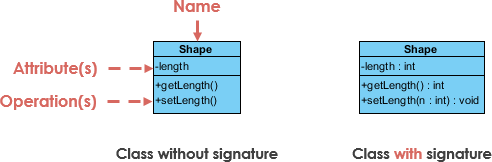
My biggest takeaway? Only the class name is mandatory. Early on, I over-engineered diagrams with every attribute and method. The tutorial gently reminded me: start simple, add detail as needed.
Attributes Section (second partition):
-
Format:
attributeName : Type -
Maps to member variables in code
-
Example:
name : String
Operations Section (third partition):
-
Format:
methodName(param : Type) : ReturnType -
Maps to class methods
-
Example:
calculateTotal() : Double
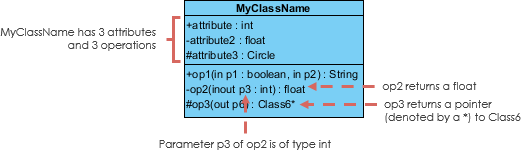
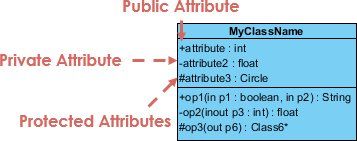
Visibility Symbols: A Quick Reference I Saved
I printed this cheat sheet:
-
+= Public (accessible everywhere) -
-= Private (class-only access) -
#= Protected (class + subclasses)
This tiny detail prevented so many design debates in code reviews.
Parameter Directionality (Niche but Useful)
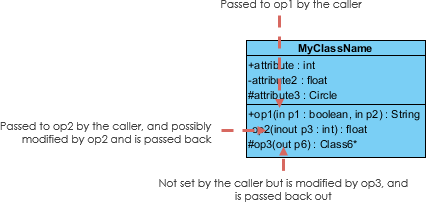
Honestly, I rarely use in, out, or inout in daily work, but knowing they exist helped me read legacy diagrams. For most greenfield projects, defaulting to in parameters kept things simple.
Choosing the Right Perspective: Conceptual vs. Specification vs. Implementation
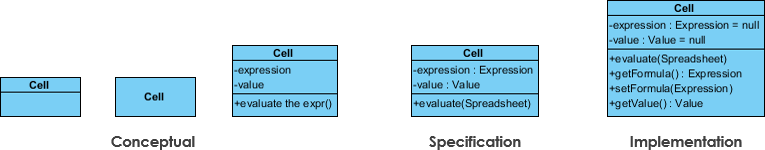
This section saved me from “analysis paralysis.” I learned to match diagram detail to my project phase:
| Perspective | When I Use It | Detail Level |
|---|---|---|
| Conceptual | Early brainstorming, domain modeling | High-level concepts only |
| Specification | API design, interface contracts | Method signatures, no implementation |
| Implementation | Code generation, detailed design | Full attributes, methods, visibility |
Pro tip: I start conceptual, then layer in specification details during sprint planning. No need to show database fields in a stakeholder meeting!
Relationships Between Classes: The Heart of UML
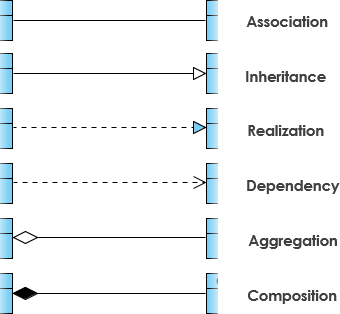
This is where UML becomes powerful—and where I initially struggled. Here’s how I now interpret each relationship:
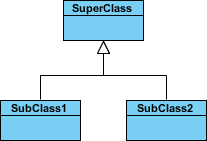
Inheritance (Generalization): “Is-A” Relationships
-
Solid line + hollow arrowhead pointing to parent
-
Abstract classes appear in italics
-
Example:
SavingsAccountandCheckingAccountinherit fromBankAccount
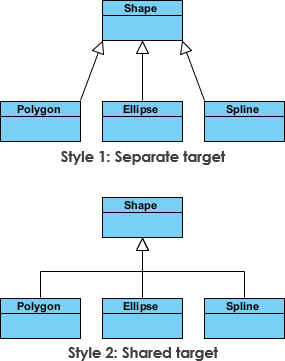
I appreciate that Visual Paradigm shows two equivalent notations—helps when collaborating with teams using different style guides.
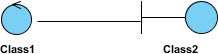
Association: Simple Connections
-
Solid line between peer classes
-
Named with verbs: “places,” “contains,” “manages”
-
Example:
CustomerplacesOrder
Cardinality: Quantifying Relationships
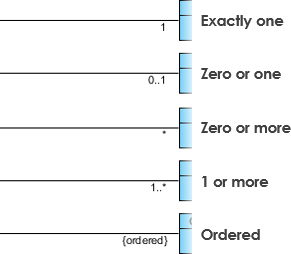
I keep this table handy:
-
1= exactly one -
0..1= zero or one -
*or0..*= zero or more -
1..*= one or more
Clarity here prevents bugs like “can a user have multiple profiles?”
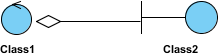
Aggregation vs. Composition: The Lifetime Difference
Aggregation (“has-a,” loose coupling):
-
Unfilled diamond
-
Parts can exist independently
-
Example:
DepartmentaggregatesProfessor(professors exist if dept dissolves)
Composition (“owns-a,” tight coupling):
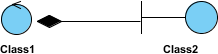
-
Filled diamond
-
Parts die with the whole
-
Example:
HousecomposesRoom(rooms don’t exist without the house)
This distinction transformed how I model data ownership in microservices.
Dependency: “Uses-Temporarily” Relationships
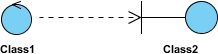

-
Dashed line + open arrow
-
One class uses another briefly (e.g., method parameter)
-
Example:
Personhas ahasRead(Book)method
I use this for utility classes or external APIs—avoids over-modeling transient interactions.
Realization: Interface Implementation
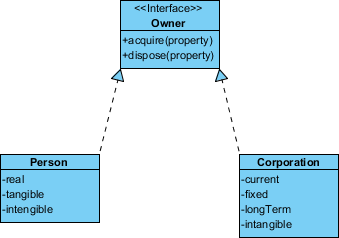
-
Dashed line + hollow arrowhead
-
Connects interface to implementing class
-
Example:
PaymentProcessorinterface realized byStripeAdapterandPayPalAdapter
Critical for clean architecture—this visual cue reminds me to code to interfaces.
Real-World Examples That Clicked for Me
Order System Diagram
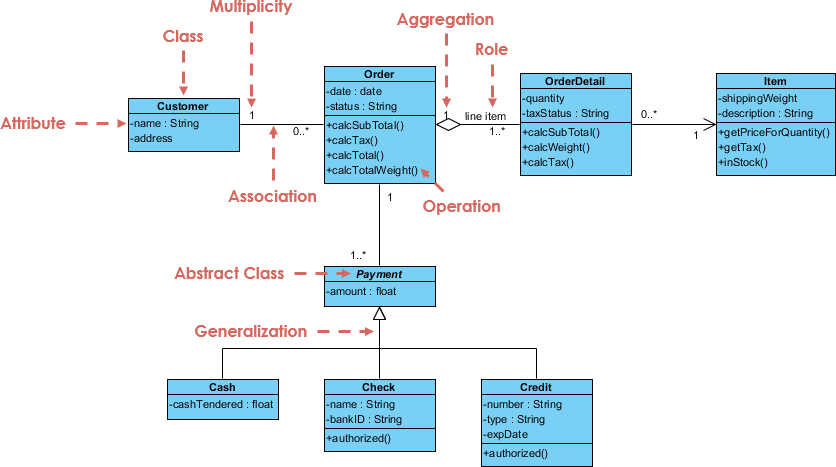
Seeing a complete e-commerce model helped me map theory to practice. I particularly appreciated:
-
Clear cardinality on
Order→OrderItem(1 to many) -
Composition showing
OrderownsOrderItem -
Dependency from
PaymentServiceto externalGateway
GUI Example with Notes
The attached notes feature was a game-changer for documenting non-obvious constraints (e.g., “Button disabled until form valid”). I now add these liberally during design reviews.
How Visual Paradigm’s Free Tools Accelerated My Learning
I downloaded Visual Paradigm Community Edition skeptically—free tools often feel limited. But after 30 minutes:
-
Drag-and-drop class creation felt intuitive
-
Auto-layout kept diagrams clean as they grew
-
Export to PNG/PDF made sharing with non-technical stakeholders trivial
The learning curve was gentler than expected. Within a day, I had a draft class diagram for my current project. Within a week, I was confidently discussing aggregation vs. composition in standups.
The AI Advantage: My Personal Take on Visual Paradigm’s Smart Features
As someone who values efficiency but distrusts “magic” AI, I was pleasantly surprised by how the AI tools augmented—not replaced—my thinking:
What Worked Well
-
AI Chatbot: Typing “Show me a class diagram for a library system” generated a solid starting point. I then refined visibility and relationships manually. Huge time-saver for boilerplate.
-
AI Class Diagram Wizard: The step-by-step prompts (“What attributes does User need?”) forced me to think through edge cases I’d otherwise skip.
-
Text-to-Model: Pasting user stories and getting a draft diagram helped bridge product requirements to technical design.
Where I Still Prefer Manual Control
-
Complex business logic: AI suggestions needed heavy tweaking for domain-specific rules
-
Team collaboration: We still whiteboard first, then digitize—AI can’t replace human alignment
Platforms I Tested
-
VP Desktop: Best for detailed work; AI feels like a co-pilot
-
AI Chatbot (web): Perfect for quick prototypes or learning checks
-
OpenDocs: Great for embedding live diagrams in Confluence/Notion
If you’re new to UML, start with the chatbot for low-stakes practice. If you’re experienced, use the wizard to stress-test your designs.
Conclusion: Would I Recommend This Learning Path?
Absolutely—with caveats. Visual Paradigm’s free resources gave me a structured, visual way to learn UML Class Diagrams without financial risk. The tutorial’s progression from concepts to relationships to real examples mirrored how my brain actually learns. The AI tools aren’t essential for beginners, but they’re valuable accelerators once you grasp fundamentals.
My advice for fellow learners:
-
Start with the free Community Edition—no need to upgrade immediately
-
Focus on one relationship type per practice session (e.g., “Today I master aggregation”)
-
Use the AI chatbot to generate examples, then break them intentionally to understand edge cases
-
Share your diagrams early; UML is a communication tool, not just documentation
Three months later, I’m not a UML expert—but I’m confident enough to lead design sessions, onboard junior devs, and create diagrams that actually get used. If that’s your goal too, this path is worth your time.
- References
- Visual Paradigm UML Tool Overview: Comprehensive overview of Visual Paradigm’s visual modeling toolset supporting UML, Gantt, WBS, and more.
- Visual Paradigm cybermedian.com/visual-paradigm-ecosystem-ai-supported-uml-diagram-featuresEcosystem: AI-Supported UML Features: Detailed exploration of AI-powered features within the Visual Paradigm ecosystem for UML diagram creation.
- UML Support in the Visual Paradigm AI Ecosystem: A Comprehensive Guide: In-depth guide covering UML diagram support and AI integration across Visual Paradigm platforms.
- Guide to Powered UML Diagram Generation: Step-by-step guide for generating UML diagrams using Visual Paradigm’s AI chatbot interface.
- How AI Chatbot Can Help You Learn UML Faster: Blog post explaining how Visual Paradigm’s AI chatbot serves as a learning companion for mastering UML notation and concepts.
- UML Class Diagram Tutorial Video: Video tutorial demonstrating UML class diagram fundamentals and best practices.
- AI-Assisted UML Class Diagram Generator: Feature page detailing the AI-powered wizard for creating professional class diagrams with guided assistance.
- Visual Paradigm AI Features Demo: Video demonstration of AI capabilities within Visual Paradigm for automated diagram generation.
- Getting Started with Visual Paradigm AI: Beginner-friendly video walkthrough for leveraging AI tools in Visual Paradigm.
- Visual Paradigm UML Tool Features: Official feature listing for Visual Paradigm’s UML modeling capabilities and supported diagram types.
- AI-Powered Use Case Modeling Studio: Tool page for the AI-driven use case modeling studio that converts text descriptions into UML models.
- Visual Paradigm Desktop AI: Activity Diagram Generation: Release notes covering new AI-powered activity diagram generation features in Visual Paradigm Desktop.
- What is a UML Diagram?: Figma resource library article explaining UML diagram fundamentals and use cases.